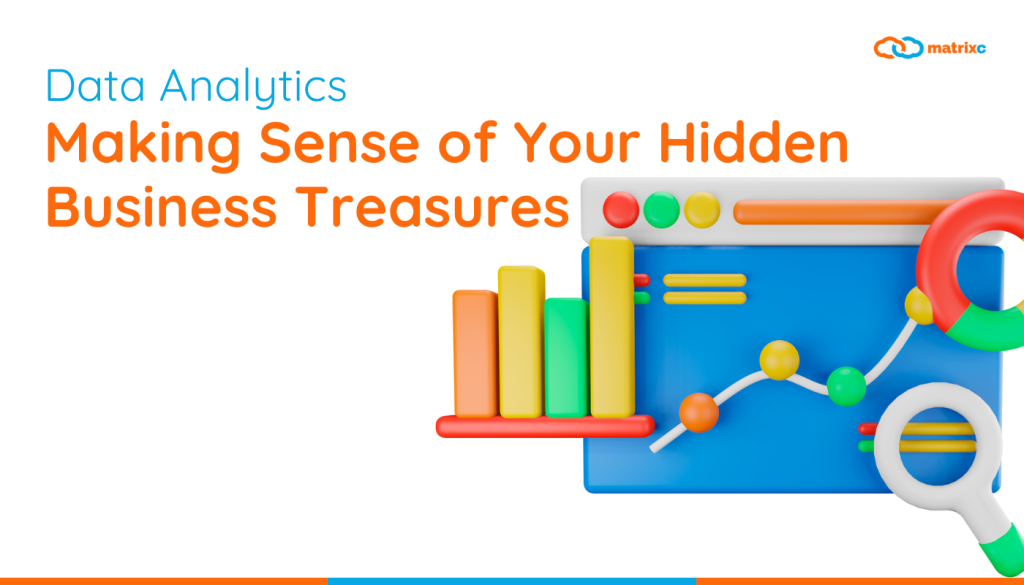
Remember that scene in Indiana Jones, where he faces a maze of booby traps and hieroglyphs? That’s how many business owners feel staring at their data dashboards – a confusing jumble of numbers and graphs. Relax, adventurer, because you don’t need a whip to unlock the secrets hidden within your data. All you need is a trusty guide called statistical analysis.

So, before you curse Excel or vow to throw your laptop into the temple of doom, let’s unravel the mystery. Data, simply put, is the raw material, the digital crumbs your business leaves behind. Analytics is the chef who whisks it all together, searching for patterns and trends. And statistical analysis? That’s the secret sauce, the sprinkle of math that transforms bland data into a flavorful feast of insights.
Imagine having a magic crystal ball that tells you exactly which customers are about to jump ship, or which marketing campaign will explode your leads like popcorn. That’s the power of statistical analysis. It’s not magic, though – it’s a systematic approach to understanding your data and extracting its hidden gems.

Here’s the recipe:
- Gather your ingredients: Where does your data live? Online forms, surveys, website clicks, maybe even dusty sales receipts – every morsel tells a story.
- Clean up the kitchen: Messy data leads to bad decisions. Fix typos, remove duplicates, and organize everything neatly.
- Explore the pantry: Take a good look at your data, get to know its quirks and flavors. Charts and graphs become your best friends in this step.
- Crank up the stats: This is where things get exciting! Statistical tools like averages, correlations, and even fancy regressions help you see patterns you might have missed.
- Voila! Insights served fresh: Now that you understand your data, you can make decisions with confidence. Optimize marketing campaigns, allocate resources wisely, and watch your business flourish.
The beauty of this recipe is that you don’t need a Ph.D. in statistics to get started. There are plenty of user-friendly tools like Excel, online platforms, and even some basic coding (Python, anyone?) that can help you crack the data code.
And guess what? The benefits are endless. Imagine predicting customer churn with 90% accuracy, boosting your profits by 20%, or streamlining operations like a Jedi master. That’s the power of data, wielded wisely through the magic of statistical analysis.
So, don’t let your data sit in a dusty corner, gathering cobwebs. Grab your analytical spatula, fire up the stats oven, and get ready to bake up some delicious insights. Your business success depends on it!
Now, it’s your turn to embark on your data-driven adventure! Share your experiences, ask questions, and let’s create a community of data-savvy entrepreneurs together. Remember, the only booby traps you’ll encounter are the ones you let fear create. So, grab your whip of curiosity and dive into the exciting world of data analysis!
Read more about Data Analytics and cloud technology on our blog post
1. Versa Asia: Realizing financial technology with Google Cloud Platform
2. BindPlane OP & GCP!
3. Generative AI: A Gateway to Creative Innovation
4. Elevating Business Horizons: Navigating the Google Cloud Platform (GCP) Odyssey
5. Decoding the Magic of Generative AI: How it Learns, Creates, and Challenges Our World
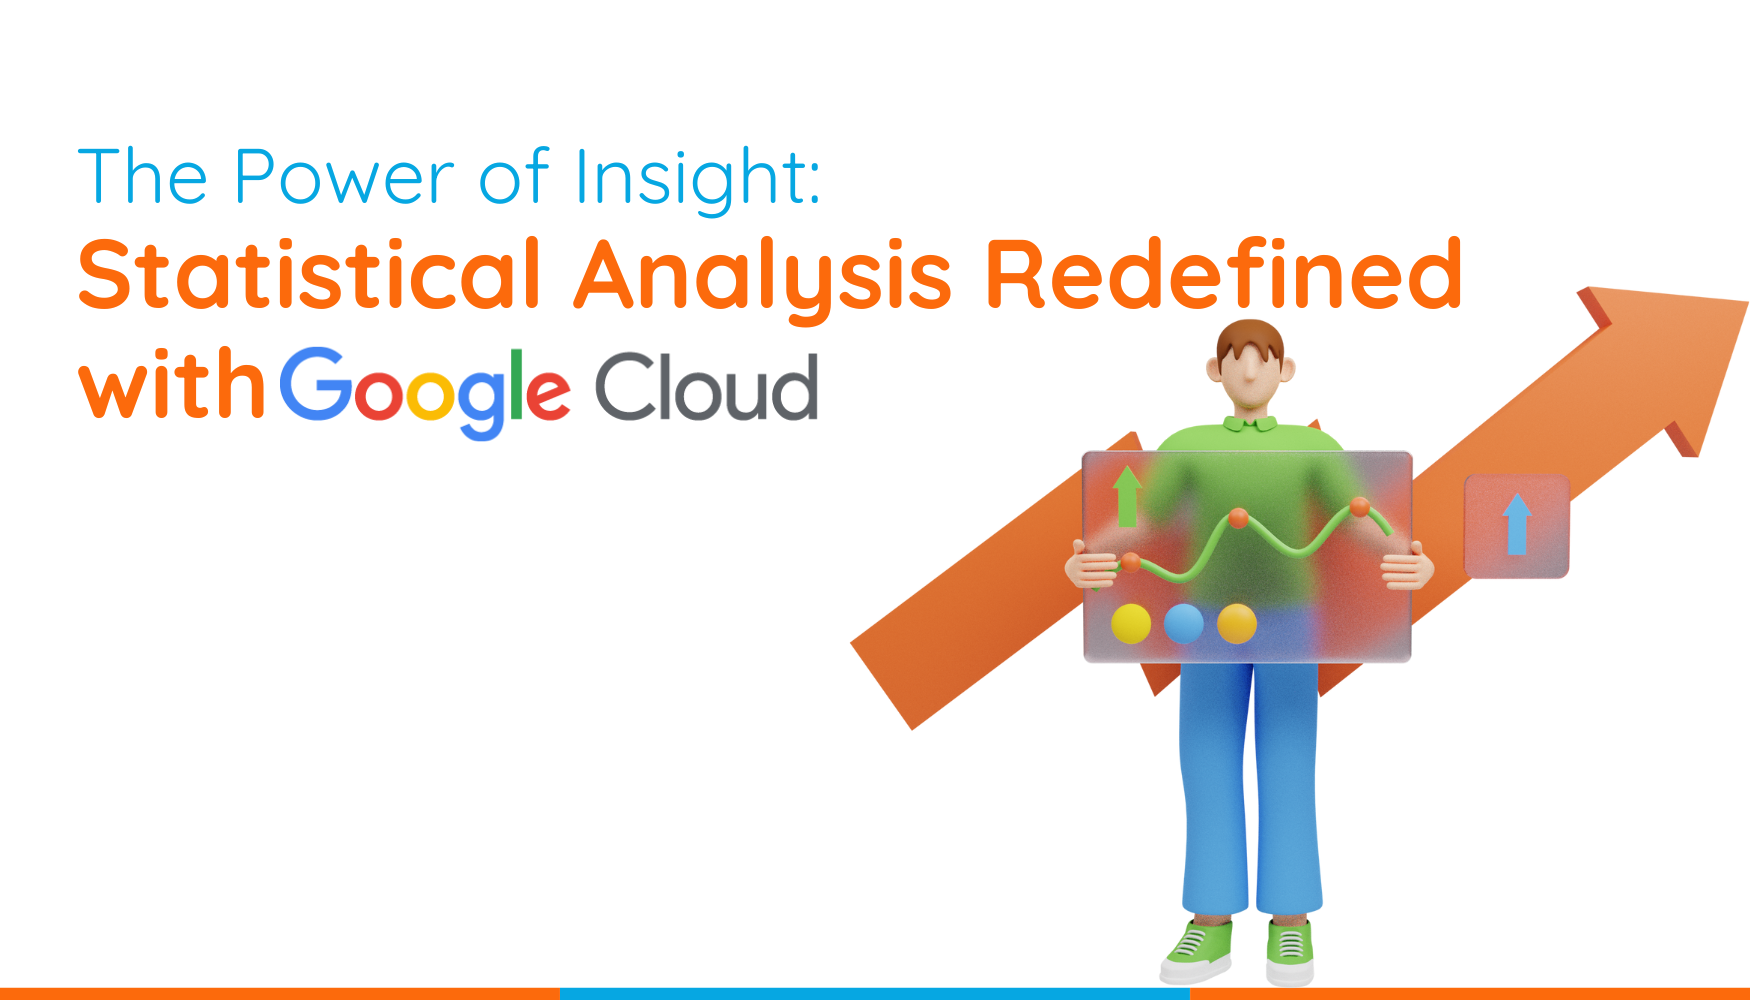
6. The Power of Insight: Statistical Analysis Redefined with Google Cloud
Curious to explore more about our solutions and its potential applications? Reach out to us here for further insights, discussions, or inquiries. Let’s delve deeper into the world of innovation together!